We have revamped the campus electricity usage page that Core Services released last March with a new look and a new feature just in time for the National Campus Energy Challenge 2008.
Sparklines
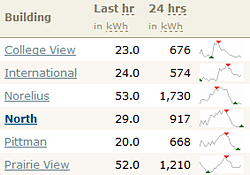 The overview page now features sparklines—”intense, simple, wordlike graphics”—that succinctly depict the past 24 hours of electricity usage for each monitored building. High points are marked with red and low points are marked with green. Hopefully these graphics will give you a quick overview of current usage trends across the board.
We are happy to use the free and open source Sparkline PHP Graphing Library to generate our sparklines.
Charts
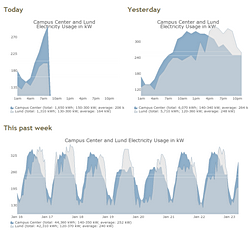 While all of the features for the charts are the same, we gave them a visual makeover to bring them more in line with the dynamics of our template. In this process, we simplified them in ways that would hopefully make Edward Tufte proud.
To generate our charts, we are using the Image_Graph PEAR module.
What do you think?
Do you like the changes? Is there a feature that you would find useful? Sound off in the comments.